Tree ring analysis
August 18, 2012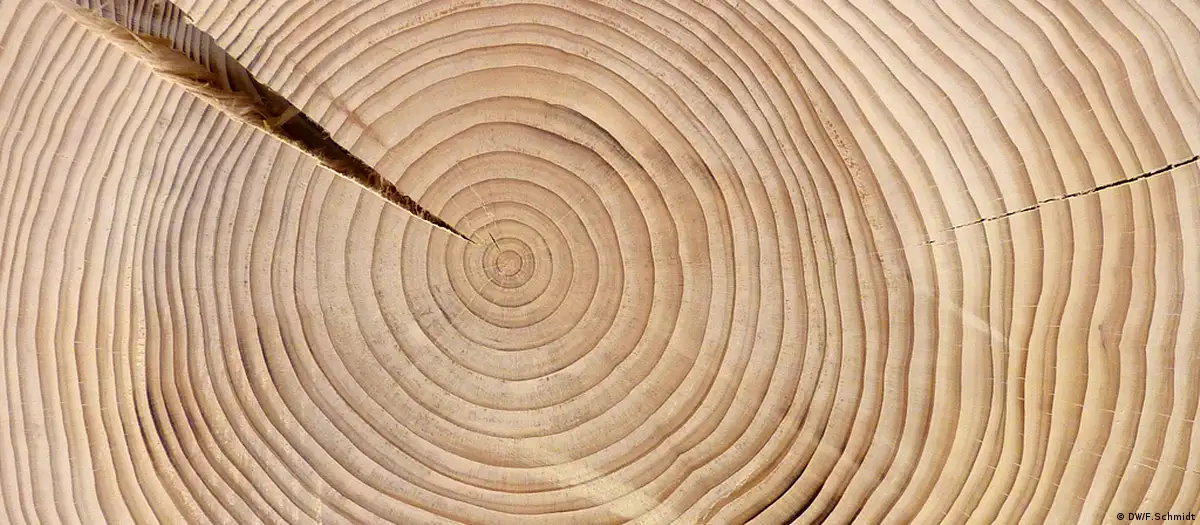
Each year, between spring and fall, cells divide under a tree's bark and a growth ring emerges. Every ring contains information for climate researchers because no two rings are the same. In warm temperatures, trees grow faster than if it's cold. Trees will grow less in dry climate than in wet periods.
These differences are particularly obvious in trees that grow close to the tree line, like in high mountains.
"Trees can't grow beyond the upper timber limit because it's too cold there. Cold years usually become materialize in narrow growth rings. This pattern is repeated not just in one, but in several trees that grow close to the tree line," explained Jan Esper, the head of the tree ring research section at Mainz University. His field of research is called dendrochronology.
Finland's high north is home to a climatic border area which makes for ideal research conditions for dendrochronologists because they can analyze more than living trees there. Dead wood also keeps the information, making it some sort of a mini climate archive.
"There are many shallow lakes in Finland. If trees fall into a lake they are conserved in great shape for thousands of years," Esper said. With the help of Finnish trees, he and his team reconstructed the climate of the past 2000 years.
Tree sampling is hard work
Markus Kochbeck, head of the research laboratory in Mainz, put a core drill onto a tree trunk to take a sample. The drill resembled a tube and was turned manually. With the help of a lance, the drill core was pushed out of the tube afterwards. The drill core looked like a striped pencil and was about half a centimeter wide. Every ring marked one year in the tree's life. Kochbeck then glued the drill core onto a wooden board and smoothed it out with a special plane giving it a smooth surface and made all of the rings visible.
The drill core was then put under a stereo microscope which was attached to a so-called x-table. "The table is equipped with an electronic system", Kochbeck explained, "and we measure the rings with the help of the table movements." This enabled the scientists to draw up a curve, with the years on the x-axis and the tree ring width on the y-axis, measured in millimeters.
From microscope to computer
The researchers would draw up one curve per drill core and then overlap many of them - at least 100 - with the help of a computer program. By looking at succinct years - years with particularly low temperatures that made for particularly narrow rings - the team was able to assign dates to the tree samples. Since the researchers analyzed many trees from different periods, they were able to develop a constant timeline. Life cycles of some trees have to overlap by a few decades in order to do so. That's how the researchers discovered similarities between trees of different ages.
Most similarities were found by looking at the coldest years in history because the rings were particularly narrow then. "We then try and overlap the curves," said Kochbeck, adding that the work was done visually on the computer or mathematically with the help of correlation.
Using the same method, Finnish researchers have managed to look back some 7000 years. Jan Esper and his team only looked back 2000 years, but by using an additional technology, they were able to make their findings even more precise.
Apart from looking at the width of the growth rings, the researchers also measured the density of cells in the wood, using a special x-ray machine. "We measured the width of the cells in the last or the penultimate row of cells in a growth ring. The width of a cell wall is a better indicator for summer temperatures," he said.
Romans had it 0.6 degrees warmer
According to the measurements findings, temperatures dropped continuously in the 2000 years before the year 1900, around the time the Industrial Revolution began, by about 0.3 degrees Celsius (2.44 degrees Fahrenheit) per 1000 years. The researchers didn't consider the time after 1900 for their measurements because of the new phenomenon impacting on climate research, the rise in greenhouse gases.
The Finnish tree rings also had something to tell about other climate events. The climate curves gave information about volcano eruptions, because in the wake of these events, temperatures generally drop by about 0.7 degrees Celsius. Warm and cold periods can also be identified this way. During Roman times, temperatures were very high. The same goes for the so-called Medieval Climate Optimum, a warm period in the Middle Ages. This was followed by a colder phase, the so-called small ice age. In the second decade, temperatures started rising again.
Today, climate modelers who try and predict the climate of the future could potentially also benefit from the results of the research. The data stems from a time when there was little CO2 in the atmosphere. And so, the trees can tell researchers something about natural climate change - with no human impact.